
You’ve set up your Google Analytics 4 tag and your events, and you want to ensure they are working correctly.
There are a few ways to test things out, but be mindful that some installations exclude users logged into their admin dashboard, e.g., on WordPress (content management system) with the GTM4WP plugin.
If you followed our setup guide, you may also have excluded your Internet Protocol (IP) address. In this case, you’ll want to remove that temporarily.
Lastly, ensure your browser or virus software does not block the Google Analytics tag if you find nothing fires. You may also want to double check that the correct tag is added if nothing shows up.
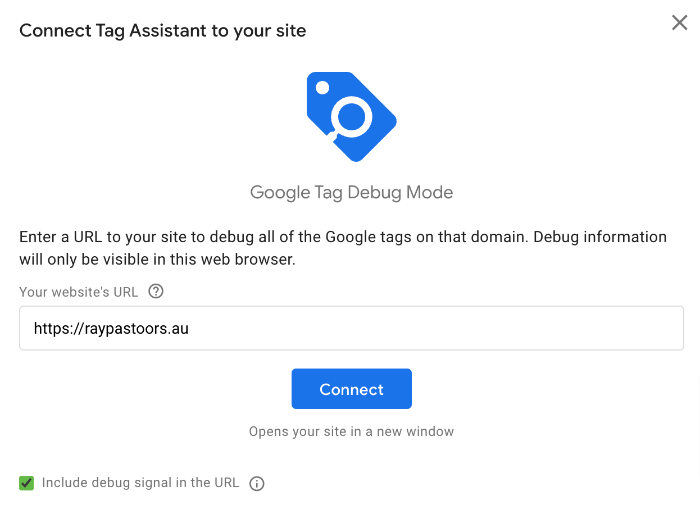
It is probably the best option because it is free to use and can be accessed without the need to log in (except if reviewing Google Tag Manager for advanced setups).
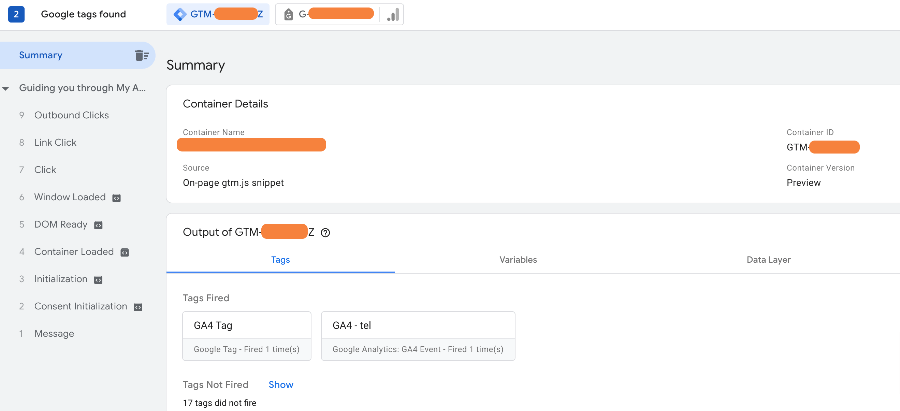
If you use Google Tag Manager, log in to that website first so you can use the preview function to see what tags are added to your container.


Pictured above, you can see a few things:
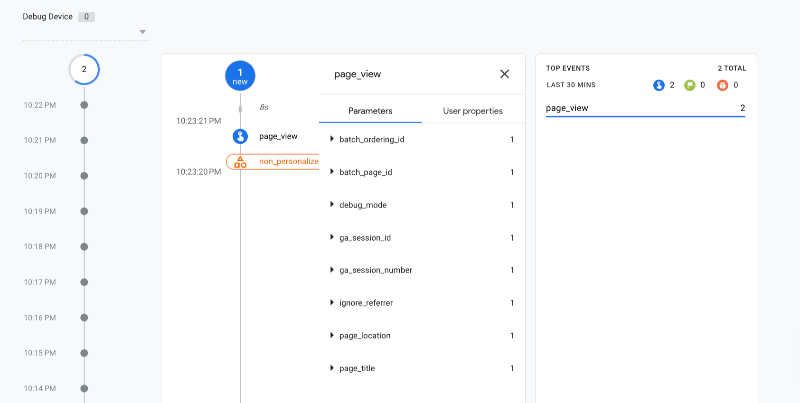
The debugview is more advanced but an excellent way to test that your analytics work correctly.
You can use the Google Analytics debugger, a Google Chrome extension, to enable the debug view.

Download the extension and save it to your favourite bar. Select the envelope icon when on your website to enable the debug mode.

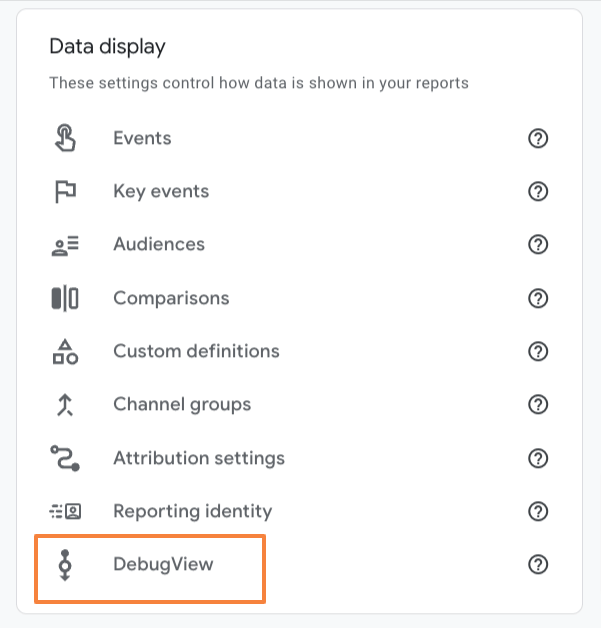
After that, go to the Admin section of your Google Analytics dashboard. It’s the gear icon at the bottom left of the dashboard.

Then look for Data Display > DebugView.
Wait a few seconds to see if anything fires, then click on the item to explore the details further.

Look at our event packages to get your event tracking needs sorted.
We’ll even help you identify what key actions users take and what will be worthwhile tracking based on our 20+ years of expertise.