What actions does a user take or not do on your website?
Understanding how to track website actions can help you understand your users more, be used for targeting people in advertising, and also help to improve your conversion rate optimisation.
What used to be called goals is now called Events in Google Analytics 4.
If you’ve already set up your GA4 property, the next step is to focus on what events you can map and track on your website or app.
In this post, we explain:
An action is something someone takes or does on a website.
Actions are often focused on the bottom end of the funnel. Think purchase or form submit.
However, what happens before this is just as vital.
When we consider that, on average, 70-80% of people abandon their carts, is it not worth knowing what people do before they decide not to check out or finish a journey?
For example, think of a train passing through a town.
What actions does the train (website user) take?
There are 4 different types of events in GA4. They range from low to high effort required to implement and use them for your website or app tracking.
Events previously sent data, including action, label, and category information. Now, they have parameters (information) that allow flexibility in creating and using events.
Examples of Automatic Events include first time visitor, session started and engaged session (the user has engaged for 10 seconds or more, visited two or more pages or taken one or more key event actions). You’ll find a full list of automatically collected events in the Google help centre.
Enhanced Events (actual events) include page view (this cannot be off), 90% scrolls, outbound clicks, site search (on site), YouTube video (start, progress and complete), form interactions and file downloads.
Recommended Events include adding to cart, begin checkout, purchase, login, and social share. A full list can be viewed to identify other use cases.
To set up eCommerce events, including purchase values, you’ll need to manually tag the website to send data variables across to Google Analytics 4.
For WordPress users, you could use a paid plugin like MonsterInsights or Conversios (which provides free limited eCommerce reporting).
Shopify websites can use the free Google and YouTube app or a paid tool like Little data.
You can create a Custom Event if none of the above event types can be used.
This is a difficult process, so before you start, check that you cannot use any other event types for your measurement. A custom event is best set up by a developer or tag specialist.
Good to know: By default, 5 parameters are collected in all events. They are:
It’s worth noting that In GA4, events can carry up to 25 additional parameters. This will allow you to collect more information based on each event type. Google has, however, set character limits relating to event collection.
An action that you want to measure. Examples could include:
An action that matches your business or website’s primary goal. Examples could include:
When you mark an item as a conversion (now called a key event), it becomes available in your Google Ads (if you previously linked this).
Note conversions (key events) are set up as events and toggled as key events in the ‘Admin’ and ‘Events’ sections under “Data display”.
The key event is a new term introduced by Google Analytics in March 2024 to prevent confusion about the word “conversion” reporting in Google Ads. Although, it has created another term, it did nothing to fix the discrepancy issues of Google Ad conversion reporting.
Essentially, you’ll see conversions named as key events in all your standard, custom and Explore (drag-and-drop) reports.
The term “conversion” will remain used for the Google Ads report only. This is outside the Reports window and on your main menu’s “Advertising” section.
Events can be set up in a few different ways depending on your platform, budget and preference.
Check out our tailored event packages to help track website actions that matter for your website.
An event would fire off all the time if it had no trigger.
For example, if you create an event for a purchase but don’t set a trigger, a purchase event will fire every time someone views a page. That would give you the wrong data and story to tell.
Common triggers for events:
Now that you’ve set up your events, it’s time to test everything. You’ll want to ensure the event is tracked correctly and accurately so your data can tell you the right story.
To do this, you have two options:
Google Tag Assistant can be accessed on its website. The tool is also used in Google Tag Manager when you preview your tags.
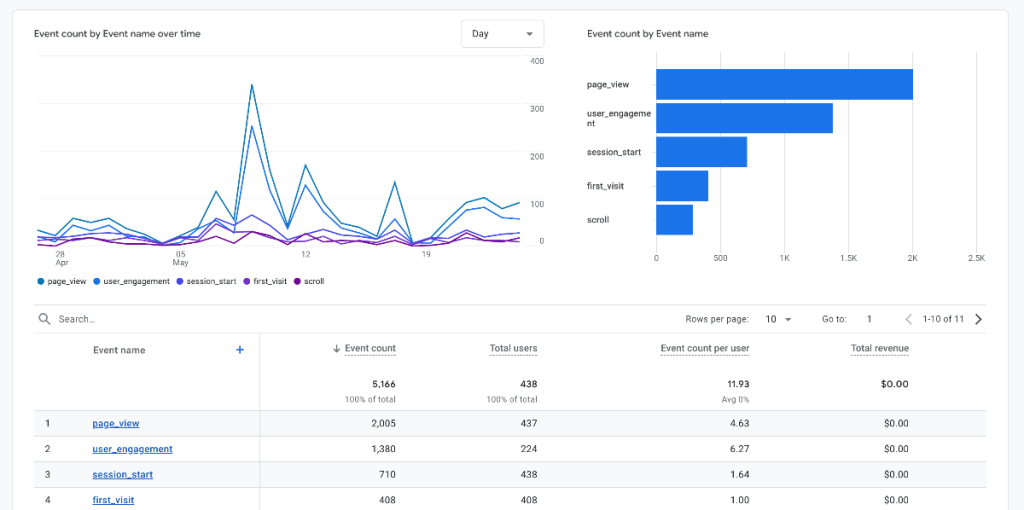
Once you’ve set up and tested your events, you’ll want to view how your events are performing.
It’s best to do this after you have enough data. Depending on how much traffic you get, this might be 1-3 months or more.
Events, by default, count every time they occur. Previously, Universal Analytics counted only once per session (visit). Look at the event counts per user and users to identify unique event usage. You can also restrict events to be counted based on other rules when setting up events.
Events have a 24-hour delay, sometimes up to 72 hours. Even after you set them up, this delay can apply to future data, too.
To view the data, check out the “Reports” menu.
Business objectives menu: Events are under “Examine user behaviour”.
Lifecycle menu: Events will be under the “Engagement” section.
Events are also reported elsewhere in standard reports and the Explore report tool.
Look at the following:
Our tailored event packages help map out the events that matter, tag and track the key items you need to know for your website.