
Google launched Google Analytics 4 (GA4) on 14 October 2020, the next evolution of Google Analytics.
This article has been updated as of May 2024 to provide more up-to-date information.
On 16 March 2022, Google announced that Universal Analytics would no longer collect data as of 1 July 2023 and that all of the data would be removed on 1 July 2024.
GA4 is the default experience for new Analytics users.
Read on to discover a few new features available on GA4 and how they can help you develop and improve your website.
Universal Analytics features three types of data settings: Account, Property and View. GA4 features only two, which are Account and Property.
This new version of Google Analytics also defines certain elements differently than previous versions.
One of the reasons for this change is that Google is preparing for a world where users will continue to opt out of cookies. In Google Analytics case, first-party cookies.
A cookie is a piece of code (Javascript) stored on a web browser to tell tools like Google whether you have been to the site before and some of your demographics.
Since Apple changed the game with its iOS tracking consent tool, Google Chrome has finally said it will launch cookie consent around July 2023, which is expected to remove third-party cookies. These cookies are already banned on Safari and Firefox, which track users across multiple sites.
Although removing third-party cookies does not impact your Google Analytics tracking, it’s important to note the challenges Google and us marketers will face with fewer data points. Hence, why tracking what is happening on your website and using that as part of your remarketing is more important than before. It also highlights a growing trend around users wanting consent for tracking overall.
Goals have been replaced with combining the events feature, and then you have conversions separate to this for your eCommerce, like tracking or actions you decide to be marked as a conversion manually from the events dashboard.
Events – user interactions that include page views, clicks, or interactions – no longer require customised code for on-site tracking.
What used to be known as Dimensions are now known as Parameters. These small details provide content to a website user’s action or event.
In Universal Analytics, events were limited by event category, action, or label categories. With this new setup, users can bring in a whole lot more information or attributes with every event to further power their insights.
Essentially, there are now four types of events:
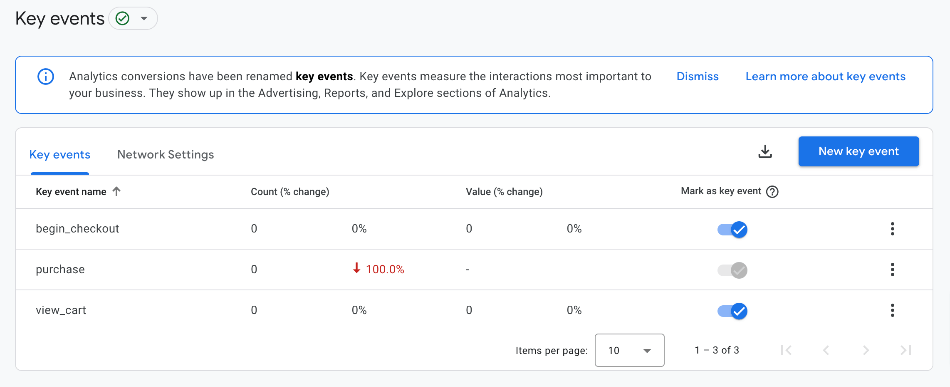
An event can be marked as a conversion. As of April 2024, Google Analytics announced that this would be renamed ‘Key events’ and that the word ‘conversion’ would be used only in the Advertising report menu when referring to Google Ads. Confusing? Yes!
To mark an event as a key event, go to the Admin (gear icon) > Data display > Key events and use the toggle to mark it on or off as a key event.
The hardest thing to swallow for transitioning to the platform is getting eCommerce data manually is a bit difficult.
For users familiar with Universal Analytics or a plugin, connecting your sales information to that tool in a few clicks is much easier.
There are some exceptions now that platforms have prepared for the change.
Squarespace supports the G-ID (Google tag) and, once added, will automatically track eCommerce variables for you. Using the scheduling tool Acuity, you can add your tag there.
Shopify has an eCommerce integration with the Google channel app.
WordPress and Magento rely on plugins to achieve eCommerce data.
eCommerce reporting in Google Analytics 4 reports is also known as Monetization, and features new tags for corresponding actions that are still common sense. For example, what was “promoView” is now “view_promotion”.
Understanding how to use GA4 will definitely take some getting used to, and Google themselves have pointed out that it’s better to adjust how you collect your data based on the GA4 model rather than trying to translate your existing Analytics approach to GA4.
The newly optimised search function on GA4 builds on Google’s AI (also known as artificial intelligence or machine learning).
The search bar features towards the top left of your screen after your Google Analytics 4 Account/Property name.
You can search for:
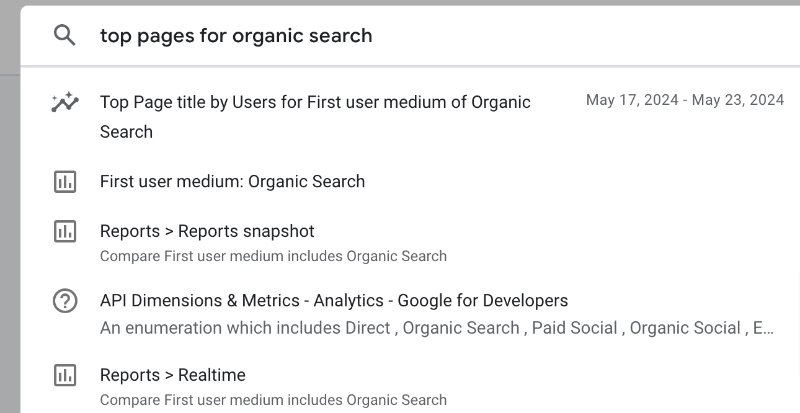
You can now use natural language to find immediate answers to your queries, such as “conversions last week from Australia”, and see the answer immediately, with an option to click on results for further insight. This is a new feature, and several questions will take time for the tool to evolve and collect. Be direct in your questions as best as possible. For example, “How many users came from Instagram last week?” still can’t be answered.
For reports, typing the name of a report or a related keyword will get you a list of reports that include them. You can also search for comparative date ranges. For example, “page views last month compared to last year” returns reports with the Page Views or the previous month compared to the same month a year ago.
You can also navigate to pages in Analytics Admin and discover relevant Insights the same way.
You can search for terms like Account ID, Property ID, or Measurement ID without navigating through Analytics to find them (trust us, this can save you a lot of time in the long run).
The new search function can be used to find specific articles to help troubleshoot issues or navigate Google Analytics 4.
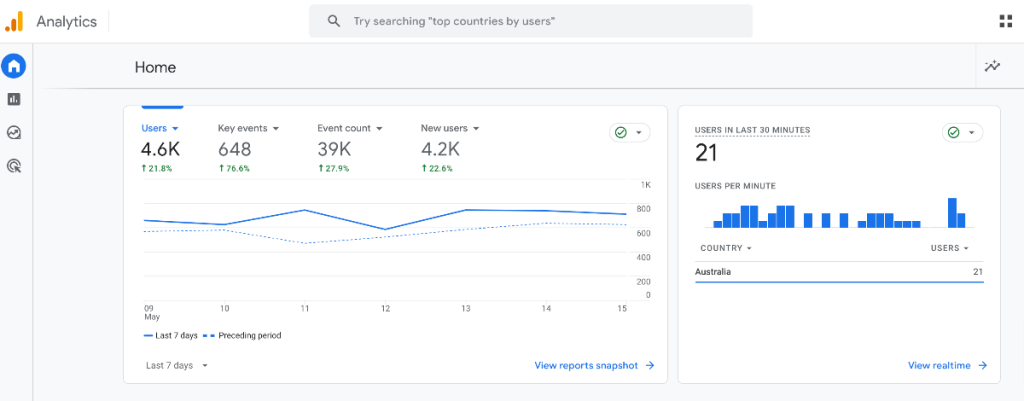
We have noticed that Google has also launched a new section called Insights on the main dashboard in March 2022, which features some of this information.
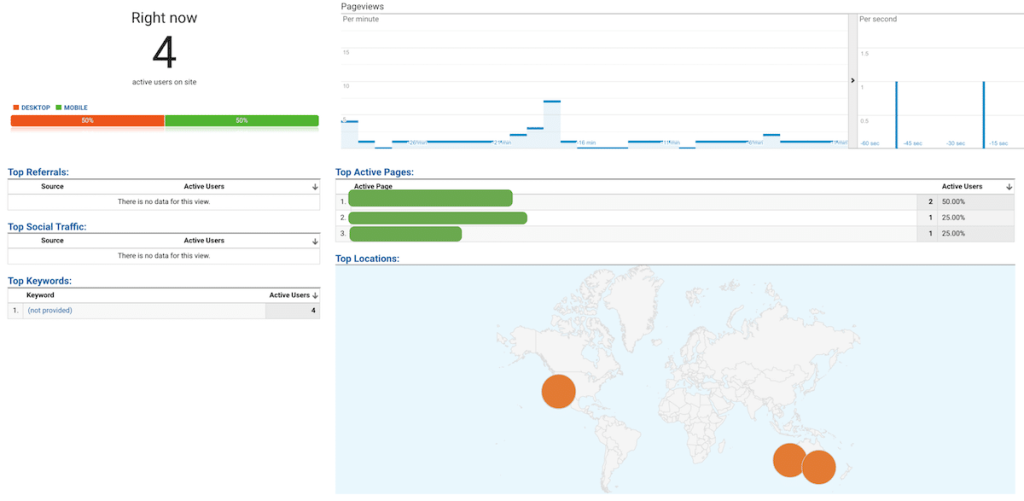
The real-time reports are continually updated based on the past 30 minutes. In May 2024, Google Analytics started to roll out the 5-minute feature that was in Universal Analytics previously.
You can see how many users are on your site in the past 5 and 30 minutes and what pages they interact with. Real-time reports are featured in Universal Analytics but have further evolved in GA4, focusing on what events your visitors are doing.
How do real time reports help you? Among other things, it can allow you to:
Universal Analytics Real Time Report
A powerful way to get actionable insights on your users, Analysis Hub (now called Explorations) was only available in 360 but is now available to everyone.
Explorations is an excellent drag-and-drop analytics tool that allows you to discover insights from Google Ads and turn them into actions.
You can configure it in a way that is helpful to you, removing and adding dimensions and metrics quickly and easily. Once you’ve discovered important data sets that could potentially impact your business, you can export them to use in other tools.
Note: The data retention setting limits how long data is held for these reports. The default is 2 months but you can change it to 14 months.
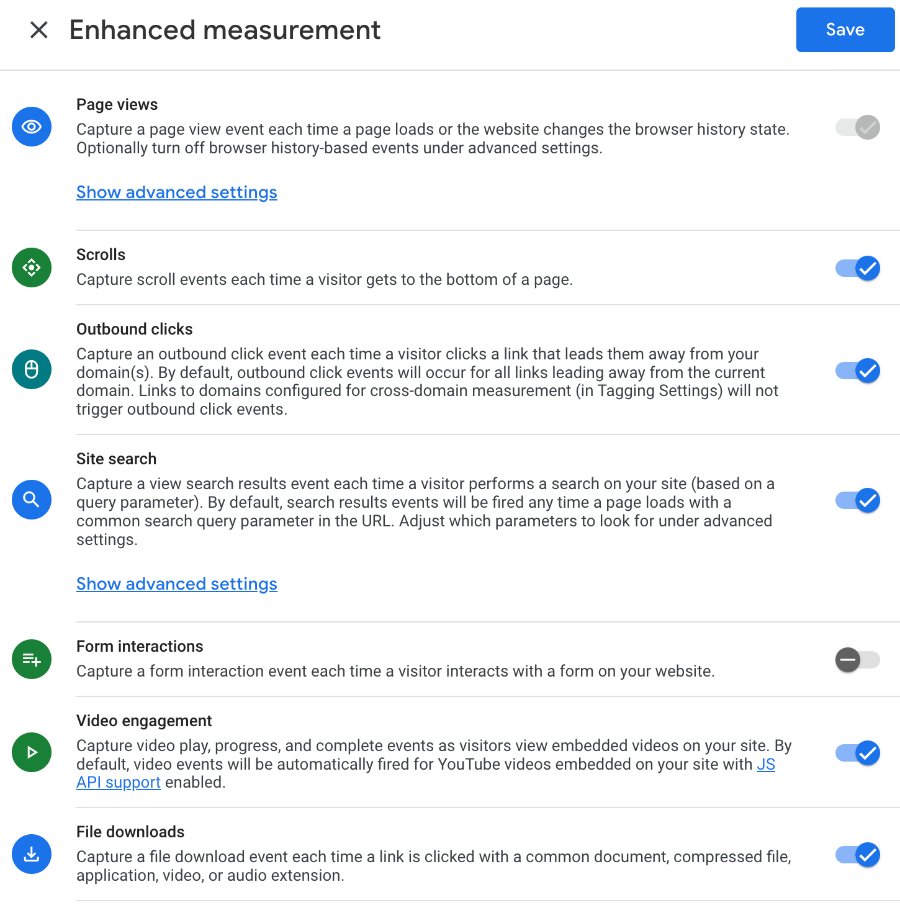
One of the most exciting new features in GA4 is called “enhanced measurement,” which automatically tracks file downloads, outbound clicks, video interactions for YouTube videos, site search, and 90% scroll events via the base GA4 tag.
In 2022, Google also introduced form interactions, which measure when someone starts and submits a form on your website. Some sites have had trouble with this. So, like any event, test it before relying on its data.
The Scroll event may also experience issues on some single page application sites.
You can simply turn on or off enhanced measurement from the GA4 interface; No additional code or tagging is required.
To do this, go to Admin > Data Streams > Select your website > Ensure the toggle is blue (on) position. You can also decide to turn some of the events on or off by clicking the gear icon and using the on and off blue toggle switches.
By adding these new events, Google is moving away from the original definition of Bounce Rate and has introduced a new metric called Engaged Sessions. This is welcome news, given that the bounce rate is often lost in its context as it is often just based on a single hit to a website, i.e. when someone loads or reloads a page, as opposed to knowing what other actions people take on a website.
Tracking down a bug on your website tracking can be a painstaking task, even for the most experienced and tech-savvy folks!
The new debug tool on GA4 can track and validate your Analytics configuration during the development stage so you can avoid nasty surprises.
More importantly, it’s a great way to identify issues when they happen.
If you have used Google Tag Manager, it’s a similar experience and hints to Google almost trying to entice people to use that platform to create or manage their event tracking.
Most settings (now 2 layers) live under property and have been simplified compared to the current setup with three layers.
Data streams let you bring in things like your app data. So, if you have an app, you get even greater insights and a clearer story for your users.
Previously, you’d need to set up your website’s and app’s analytics separately. Now you can see the experience in one platform and help to reduce retargeting to those who have already converted or done certain actions in your app environment.
When you activate Google signals on GA4, you can perform cross-platform personalisation for your website for users with Ads Personalisation switched on.
This type of personalisation can aid in cross-platform reporting, remarketing, and advertising. There are existing tools in Universal Analytics that do this, but there are a few differences in the use of Google signals using GA4.
Google Signals will provide demographic information such as age, interest (categories or themes your audience relates to) and gender. However, even if you meet the 500 users per day criteria, you’ll find that Google will give you only 10% of the data, which means this feature is barely useful.
A visitor is automatically labelled as “engaged” if they spend longer than 10 seconds on the site, view 2 or more pages/screens, or complete a conversion (key event) event.
There is also a new scroll depth measurement for enhanced engagement, which is exciting as it’s more than “average time on page” in terms of helpfulness.
This data, coupled with insights from a heatmap like Hotjar, can allow you to understand better how your content is performing or converting.
Short answer: yes!
Long answer: while GA4 is bound to be a useful tool for your website development in the long run, it’s still new, meaning not everything is as simple as possible. As time goes on, Google Analytics will continue to evolve the platform.
Are you feeling overwhelmed with Google Analytics 4? Explore our packages to make GA4 easier.